
Dynamic filters on your Dashboards
Easily select fields to filter your data on dashboards such as Users, Lead Source, Created Time or any field/s of your choice
Data pre-prepared for you
We have already done the hard-work of preparing your data for report generation, be it Lineitems or multiple Reference fields.
Drag and drop them into sections as you want
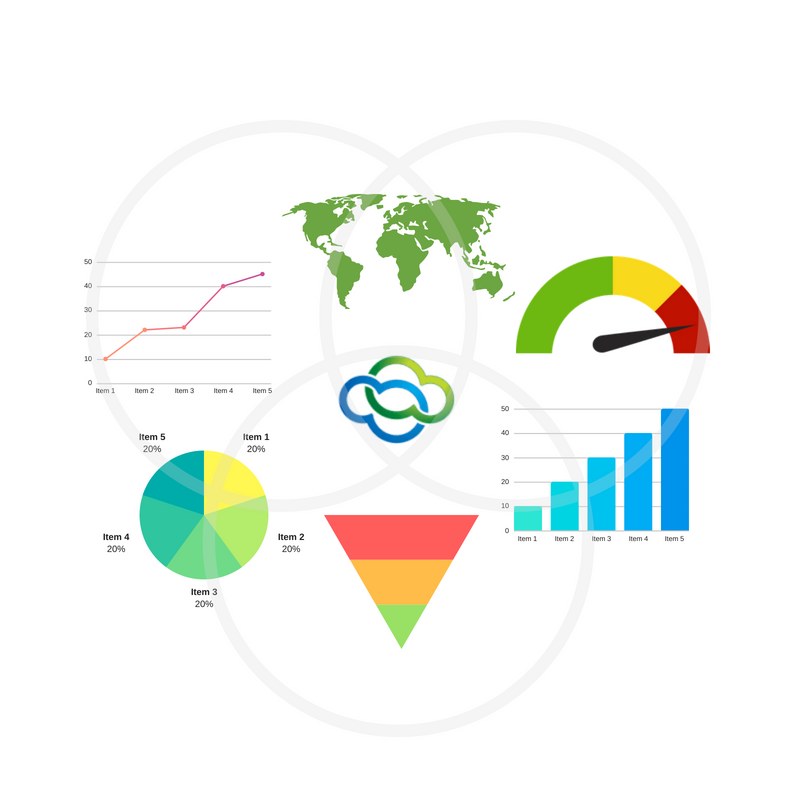
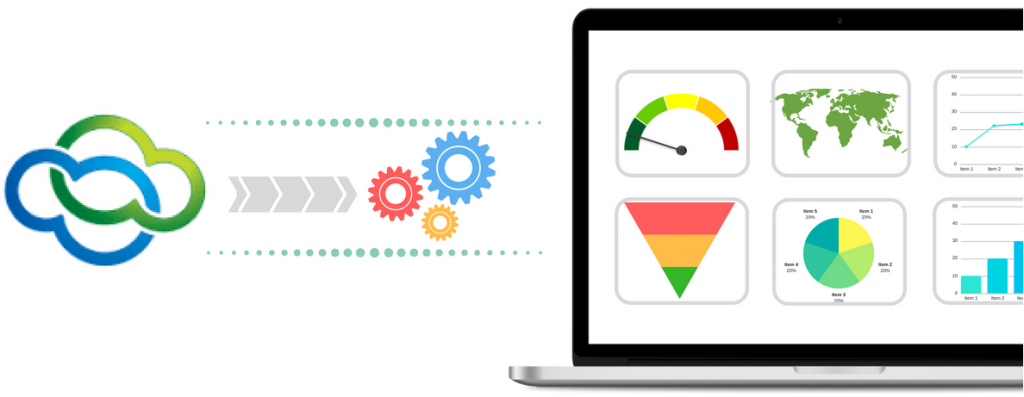
Visualize data as you want
Vt Data Studio support a range of charts. Pie charts, Bar charts, Line Charts, Guage Charts, Pivot tables are just to name a few.
All charts are powered by Google Charts platform providing the performance you need to analyze your data.
More and more charts are yet to come.
Schedule, Embed and take Snapshots
Schedule reports to be sent through email, take snapshot of your report data for future analysis and reference.
Embed you reports in any other system along with the dynamic filter capabilities.
How cool is it to show your team's productivity on a Screen in realtime!
Don't worry about CRM performance
Run report without worrying about CRM performance. Built as a standalone application it could be installed separately.
With Webhooks keep your data synced in realtime.
Connector to other BI platforms
Easily connect to other tools like Google Data Studio, Tableau, PowerBi or any other platform